FREE WHITE PAPER

Heading

Date
This is some text inside of a div block.
FREE WHITE PAPER

Heading 1

Heading 2

Heading 3

Heading 4

Heading 5
Heading 6

Lorem ipsum dolor sit amet, consectetur adipiscing elit, sed do eiusmod tempor incididunt ut labore et dolore magna aliqua. Ut enim ad minim veniam, quis nostrud exercitation ullamco laboris nisi ut aliquip ex ea commodo consequat. Duis aute irure dolor in reprehenderit in voluptate velit esse cillum dolore eu fugiat nulla pariatur.

Block quote

Ordered list

  1. Item 1
  2. Item 2
  3. Item 3

Unordered list

  • Item A
  • Item B
  • Item C

Text link

Bold text

Emphasis

Superscript

Subscript

Heading 1

Heading 2

Heading 3

Heading 4

Heading 5
Heading 6

Lorem ipsum dolor sit amet, consectetur adipiscing elit, sed do eiusmod tempor incididunt ut labore et dolore magna aliqua. Ut enim ad minim veniam, quis nostrud exercitation ullamco laboris nisi ut aliquip ex ea commodo consequat. Duis aute irure dolor in reprehenderit in voluptate velit esse cillum dolore eu fugiat nulla pariatur.

Block quote

Ordered list

  1. Item 1
  2. Item 2
  3. Item 3

Unordered list

  • Item A
  • Item B
  • Item C

Text link

Bold text

Emphasis

Superscript

Subscript

Download Resource
Thank you! Your submission has been received!
Oops! Something went wrong while submitting the form.

Manufacturers Know Quality Costs Money. Most Don't Know How Much.

Edited by
Date
May 19, 2026

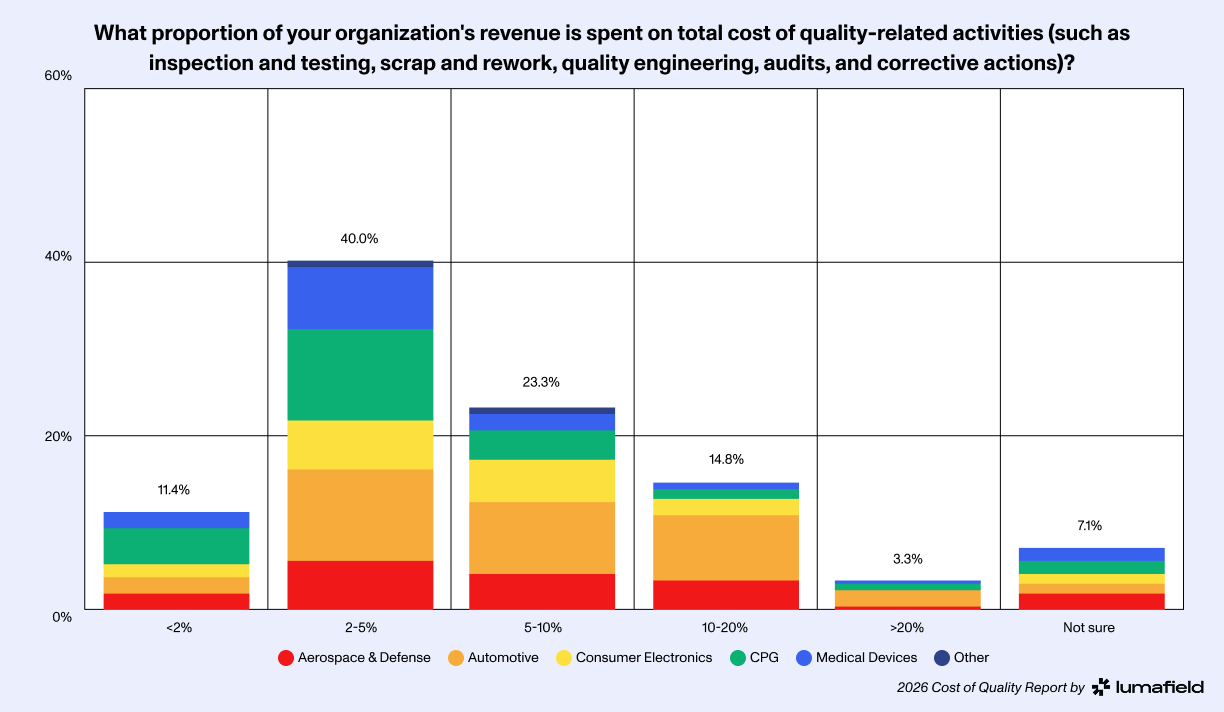
Quality costs every manufacturer money, and most believe they aren't capturing the full picture of exactly how much. 40% of the decision-makers we surveyed estimate that quality-related costs consume 2-5% of their revenue, while 42% place that figure at over 5%. Those figures are already sizable, but the majority think even those numbers understate the truth. The hidden costs, from lost sales and reputational damage to engineering hours consumed by firefighting, rarely make it into formal tracking.
Lumafield is a manufacturing intelligence platform that works with quality teams across industries to help them see inside their products, trace root causes, and build operational visibility that turns quality from a cost center into a competitive advantage. That work puts us in close contact with the measurement gaps, technology decisions, and organizational pressures that define quality management today, and we wanted to benchmark these challenges across and within industries. 

To do that, we commissioned an independent survey of 210 quality decision-makers across aerospace and defense, automotive, consumer electronics, consumer packaged goods, and medical devices in the US and Canada with NewtonX. The resulting dataset is a novel, cross-industry benchmark of how North American manufacturers measure, spend on, and prioritize quality today, along with detailed findings for each of the five industries we surveyed.

The results are striking. Only 35% of respondents use a comprehensive COQ model, despite the framework having existed since the 1950s, and 58% believe at least a quarter of their true quality costs go unaccounted for. Supplier-related quality issues ranked as the top concern across every industry we surveyed, with 41% identifying it as the single category where a 25% reduction would have the greatest operational impact. 

The report also captures a manufacturing environment under significant external pressures. 62% of respondents say tariffs and trade barriers have made it harder to ensure quality, driven largely by component shortages. Additionally, 54% of respondents say their suppliers have downgraded quality to offset tariff costs, and 27% report suppliers misrepresenting country of origin. Sentiment is cautiously positive overall, but the data makes clear that most organizations are managing quality with an incomplete picture of what it actually costs them.

The Lumafield Cost of Quality Report is available now. Take a short quiz to see how your organization compares to our full benchmark sample.
Resource
Article

Manufacturers Know Quality Costs Money. Most Don't Know How Much.

May 19, 2026
Resource

Manufacturers Know Quality Costs Money. Most Don't Know How Much.

Quality costs every manufacturer money, and most believe they aren't capturing the full picture of exactly how much. 40% of the decision-makers we surveyed estimate that quality-related costs consume 2-5% of their revenue, while 42% place that figure at over 5%. Those figures are already sizable, but the majority think even those numbers understate the truth. The hidden costs, from lost sales and reputational damage to engineering hours consumed by firefighting, rarely make it into formal tracking.

Lumafield is a manufacturing intelligence platform that works with quality teams across industries to help them see inside their products, trace root causes, and build operational visibility that turns quality from a cost center into a competitive advantage. That work puts us in close contact with the measurement gaps, technology decisions, and organizational pressures that define quality management today, and we wanted to benchmark these challenges across and within industries. 

To do that, we commissioned an independent survey of 210 quality decision-makers across aerospace and defense, automotive, consumer electronics, consumer packaged goods, and medical devices in the US and Canada with NewtonX. The resulting dataset is a novel, cross-industry benchmark of how North American manufacturers measure, spend on, and prioritize quality today, along with detailed findings for each of the five industries we surveyed.

The results are striking. Only 35% of respondents use a comprehensive COQ model, despite the framework having existed since the 1950s, and 58% believe at least a quarter of their true quality costs go unaccounted for. Supplier-related quality issues ranked as the top concern across every industry we surveyed, with 41% identifying it as the single category where a 25% reduction would have the greatest operational impact. 

The report also captures a manufacturing environment under significant external pressures. 62% of respondents say tariffs and trade barriers have made it harder to ensure quality, driven largely by component shortages. Additionally, 54% of respondents say their suppliers have downgraded quality to offset tariff costs, and 27% report suppliers misrepresenting country of origin. Sentiment is cautiously positive overall, but the data makes clear that most organizations are managing quality with an incomplete picture of what it actually costs them.

The Lumafield Cost of Quality Report is available now. Take a short quiz to see how your organization compares to our full benchmark sample.

Voyager Inspection Workflows
Introduction to Voyager
Introduction to Neptune
Introduction to Industrial CT
Introducing Mars for 100% Production Inspection
Advancing Automotive Inspection: Industrial CT for Better Outcomes
Introducing Neptune Performance and Triton Performance
The Real Cost of a Product Recall and How to Prevent One
What Industrial CT Scanning Does for Manufacturing Quality
Next-Generation Drones: Protecting Performance with Industrial CT
Explore more posts
Direkt zum Hauptinhalt
Mars: In-line arrayed X-ray system >
Platform
Branchen
Alle Branchen
Aerospace and Defense
Agriculture and Food
Athletic Equipment
Automotive
Batteries
Consumer Packaged Goods
Electronics
Medical Devices
Applications
Ressourcen
Whitepapers
Ressourcen
Webinare
Blog
Insights from lumafield
Go/No-Go
Manufacturing podcast
First Article
Editorial Publication
Firma
Über
Karriere
Drücken
Events
Starten Sie Voyager
Vertrieb kontaktieren
Speisekarte
ProdukteBranchen
Branchen
Alle Branchen
Medical Devices
Electronics
Consumer Packaged Goods
Automotive
Athletic Equipment
Batteries
Agriculture and Food
Aerospace and Defense
Applications
Ressourcen
Ressourcen
Whitepapers
101. OKTOBER
Webinars
Erster Artikel
Go/No-Go Podcast
First Article
Firma
Firma
Über
Karriere
Drücken
Events
Vertrieb kontaktieren
Starten Sie Voyager
© 2000 Lumafield. All Rights Reserved.
den Weg ändern
die Welt macht
alles
Branchen
Aerospace and Defense
Agriculture and Food
Athletic Equipment
Automotive
Batteries
Consumer Packaged Goods
Electronics
Medical Devices
Alle Branchen
Anwendungen
Assembly Verification
Competitive Benchmarking and Analysis
Defect Detection
Design Verification and Validation
Dimensional Measurement
Failure Analysis
First Article Inspection (FAI)
Material Characterization
Non-Destructive Testing (NDT)
Quality Assurance and Control (QA & QC)
Reverse Engineering
Supplier Qualification
All Applications
Produkte
NeptunTritonVoyagerMarsAtlas
Ressourcen
LernenErster ArtikelWhitepapersEreignisseWebinareUnterstützungFallstudien101. OKTOBERBlog der Ingenieure
Firma
EinloggenÜberKarriereDrückenBlogKontakt

Melde dich für unseren Newsletter an

info@lumafield.com
DatenschutzInformationssicherheitVereinbarung über Bereitstellungsdienste
© 2000 Lumafield. All Rights Reserved.