


Before any type of drilling, someone has to read the rock. That sounds straightforward until you consider what reading it requires: understanding how porous it is, how fluids move through it, how it behaves under stress, and whether the formations above it will hold. A core sample pulled from thousands of feet underground is the primary document. The question is how much you can learn from it without destroying it in the process.
For most of the industry's history, the answer was: not much. Conventional core analysis required cleaning the sample, drying it, exposing it to chemicals, and flooding it with fluids to measure how they moved through the pore structure. Some tests pushed the rock to mechanical failure to understand how it would fracture. These methods worked, and they still form the backbone of what the industry calls special core analysis, but they remain slow and expensive while also consuming the very material they’re trying to characterize. A comprehensive study of a single reservoir can take years.
A toolbox of techniques
The analytical toolbox has expanded significantly over the past two decades. Helium porosimetry measures connected pore volume by expanding an inert gas into a chamber containing the dried sample, a reliable and relatively gentle method that leaves the rock physically intact even if the cleaning process alters its original fluid state. Mercury injection capillary pressure testing forces mercury into the pore system at progressively higher pressures to map pore-throat size distributions, a powerful technique for understanding how fluids will move and whether a formation can hold a column of hydrocarbons, but one that contaminates and effectively destroys the sample in the process. Thin section petrography, in which a sliver of rock is ground to translucency and examined under a microscope, reveals mineralogy, grain structure, and the history of how the rock was formed and altered over time. Scanning electron microscopy goes further, resolving pore structures and clay fabrics at scales far below what optical microscopy can reach.
What CT adds to the picture
What micro-CT adds to this picture is the third dimension. Rather than cutting, dissolving, or mechanically testing the sample, a CT scan passes X-rays through it from multiple angles and reconstructs the internal structure as a three-dimensional volume. Pores, grains, fractures, and cement are visible in their actual spatial relationships, at resolutions down to a few microns. Most importantly, the sample comes out of the scanner intact.
That matters for several reasons. Core is finite and often scarce. A plug consumed in a mercury injection test cannot be imaged afterward to understand why the result came out the way it did. CT imaging early in an analysis program allows labs to select which samples are worth committing to destructive testing and which would only generate misleading data, because a fracture introduced during extraction had already compromised the structure. A geoscientist I spoke with at one of the largest oilfield services companies in the world described this as one of CT's most practical contributions: the ability to triage a sample set before anything is destroyed.
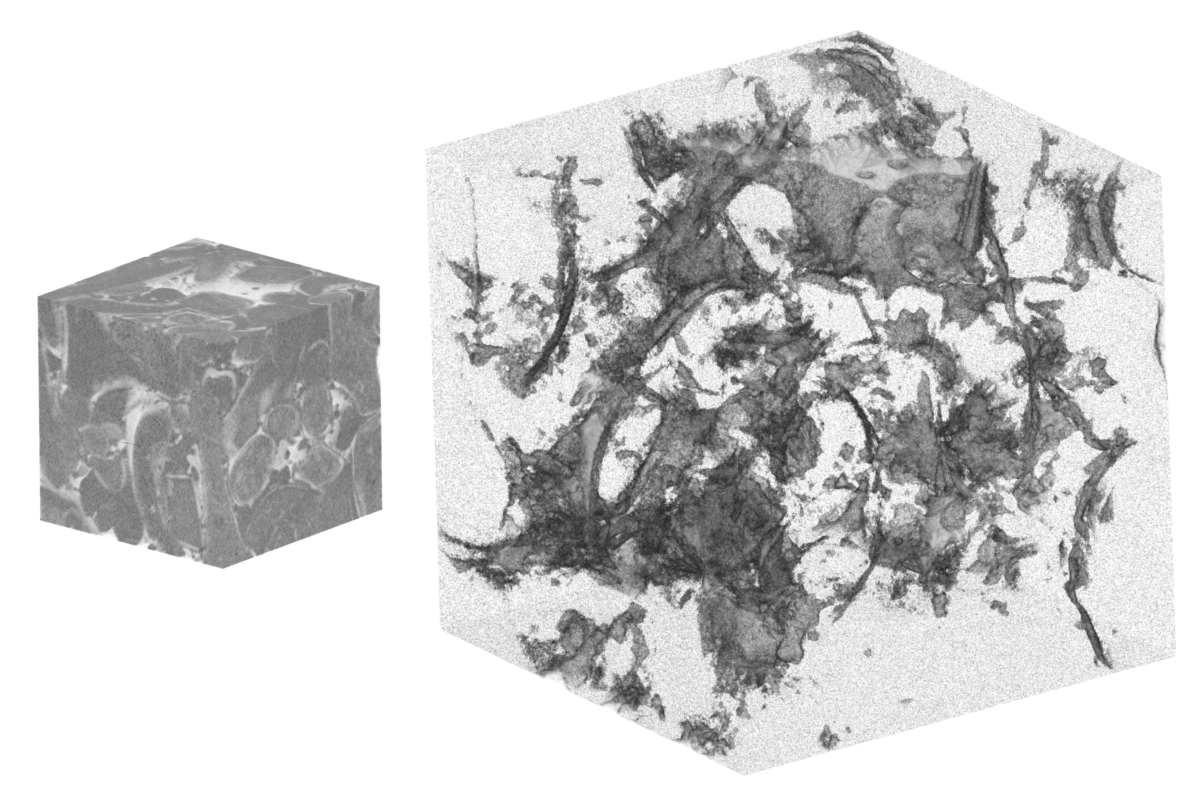
A CT-derived 3D model of pore structure in a candidate reservoir rock, the same geometry that determines both hydrocarbon extraction potential and suitability for carbon sequestration.
Running experiments on a digital twin
The 3D model that comes out of a CT scan can also be used directly for simulation. Digital rock physics uses the segmented scan volume as the domain for computational fluid flow models, calculating how fluids would move through the actual pore network of that specific sample under various conditions. SLB now offers digital special core analysis as a complement to physical testing, running virtual experiments varying fluid viscosity, interfacial tension, and wettability scenarios that would take months to execute physically and can be completed in a fraction of the time.
The limitations are real, and the field is candid about them. CT resolution today typically reaches a few microns, which means nano-scale porosity common in tight carbonates and shales remains effectively invisible and must be inferred from other measurements. The simulations assume idealized physics and do not yet fully capture the geochemical changes that happen over years of fluid injection or depletion. Digital rock analysis is most reliable when calibrated against physical measurements rather than run independently. Institutions including Stanford's Center for Carbon Storage and IFPEN, the French energy research institute, continue to work on closing these gaps, combining machine learning with CT imaging to predict rock properties faster and with less computational overhead.
How the sequence has changed
What has changed most visibly in practice is the sequencing of an analysis program. Labs now tend to run non-destructive imaging first, using CT to understand the sample population and identify the best candidates for physical testing, then commit a smaller number of carefully selected plugs to the destructive methods that generate the most critical dynamic data. That amounts to fewer tests, better tests, and more confidence in the results.
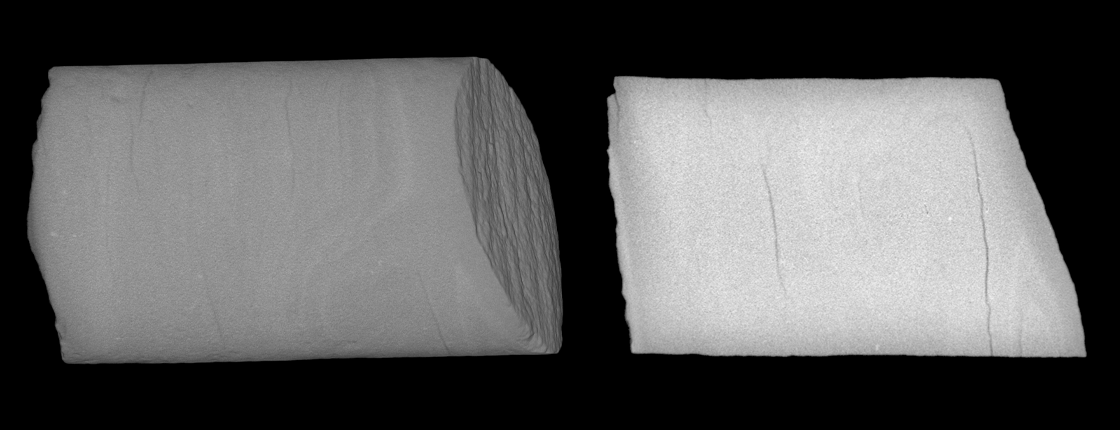
CT reveals pre-existing fractures in this shale caprock sample, disqualifying it for mechanical testing, while confirming the dense, low-porosity structure that makes caprock an effective seal.
Carbon sequestration
The same logic applies to carbon capture and storage, where core analysis is structurally similar, but the stakes are inverted. Instead of characterizing a reservoir to extract what’s inside it, geoscientists need to characterize one to ensure it will hold what is injected. Porosity and permeability still matter, but so does the chemistry of how rock responds to long-term CO2 exposure, and whether the caprock above the storage formation will remain intact over timescales that extend well beyond a production cycle. Mercury injection and micro-CT are both being applied to seal characterization, and core flooding experiments with CO2-rich brine at reservoir temperature and pressure are generating the geochemical data that regulators and operators need before committing to a site. Recent research on deep saline aquifers has used CT-derived digital rock volumes combined with machine learning to estimate porosity and permeability for CO2 storage evaluation, illustrating how digital techniques can support site screening while limiting destructive tests.
Geothermal energy
Geothermal exploration adds another variation, and an instructive twist. In a geothermal formation, porosity is often a liability instead of an asset. Heat moves better through dense, intact rock, and the questions shift from fluid flow to thermal conductivity, fracture connectivity, and how the rock behaves under cyclic thermal stress. EU-funded research programs have explicitly extended digital rock physics from hydrocarbon reservoirs into geothermal applications, using advanced imaging and simulation to understand rock behavior under the coupled thermal, hydraulic, mechanical, and chemical conditions that govern heat extraction. Here, the same imaging methods are being used to assess the opposite properties.
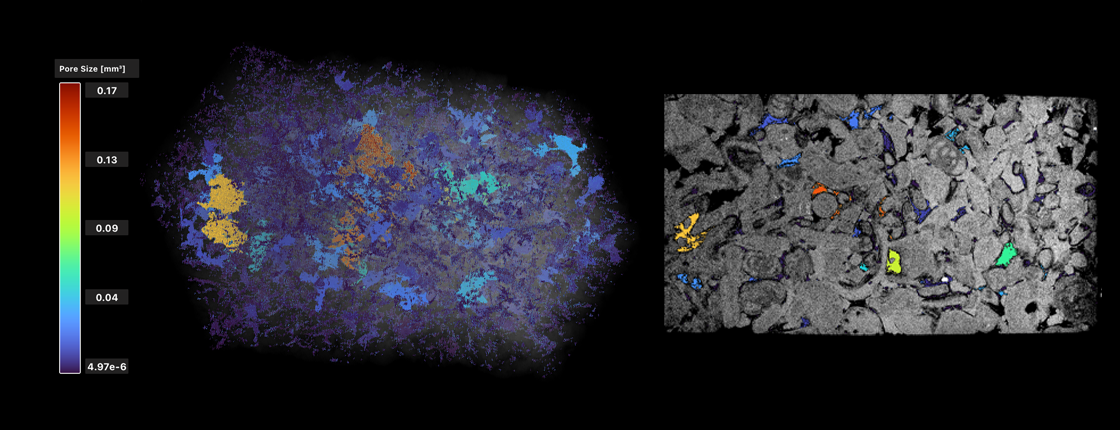
Lumafield's Voyager software quantifies pore size and distribution in core samples, generating the data that feeds reservoir simulations and CCUS assessments.
Back to the rock
Energy exploration has always been a discipline of inference. A core sample is a small physical fragment of a geological system that may extend for miles, extracted under conditions that alter the very properties being measured, and subjected to a sequence of tests that progressively consume it. The analytical methods that have developed around that problem are not a hierarchy with one technique at the top. They are a sequence, designed so that each method informs the next and the most irreversible steps are saved for last. CT fits into that sequence not because it replaces what came before, but because it tells you something about the rock before anything else does.