The Real Cost of a Product Recall and How to Prevent One
Product recalls are the end result of defects that were not caught before they reached the field. The cost of that failure compounds at every stage it goes undetected.
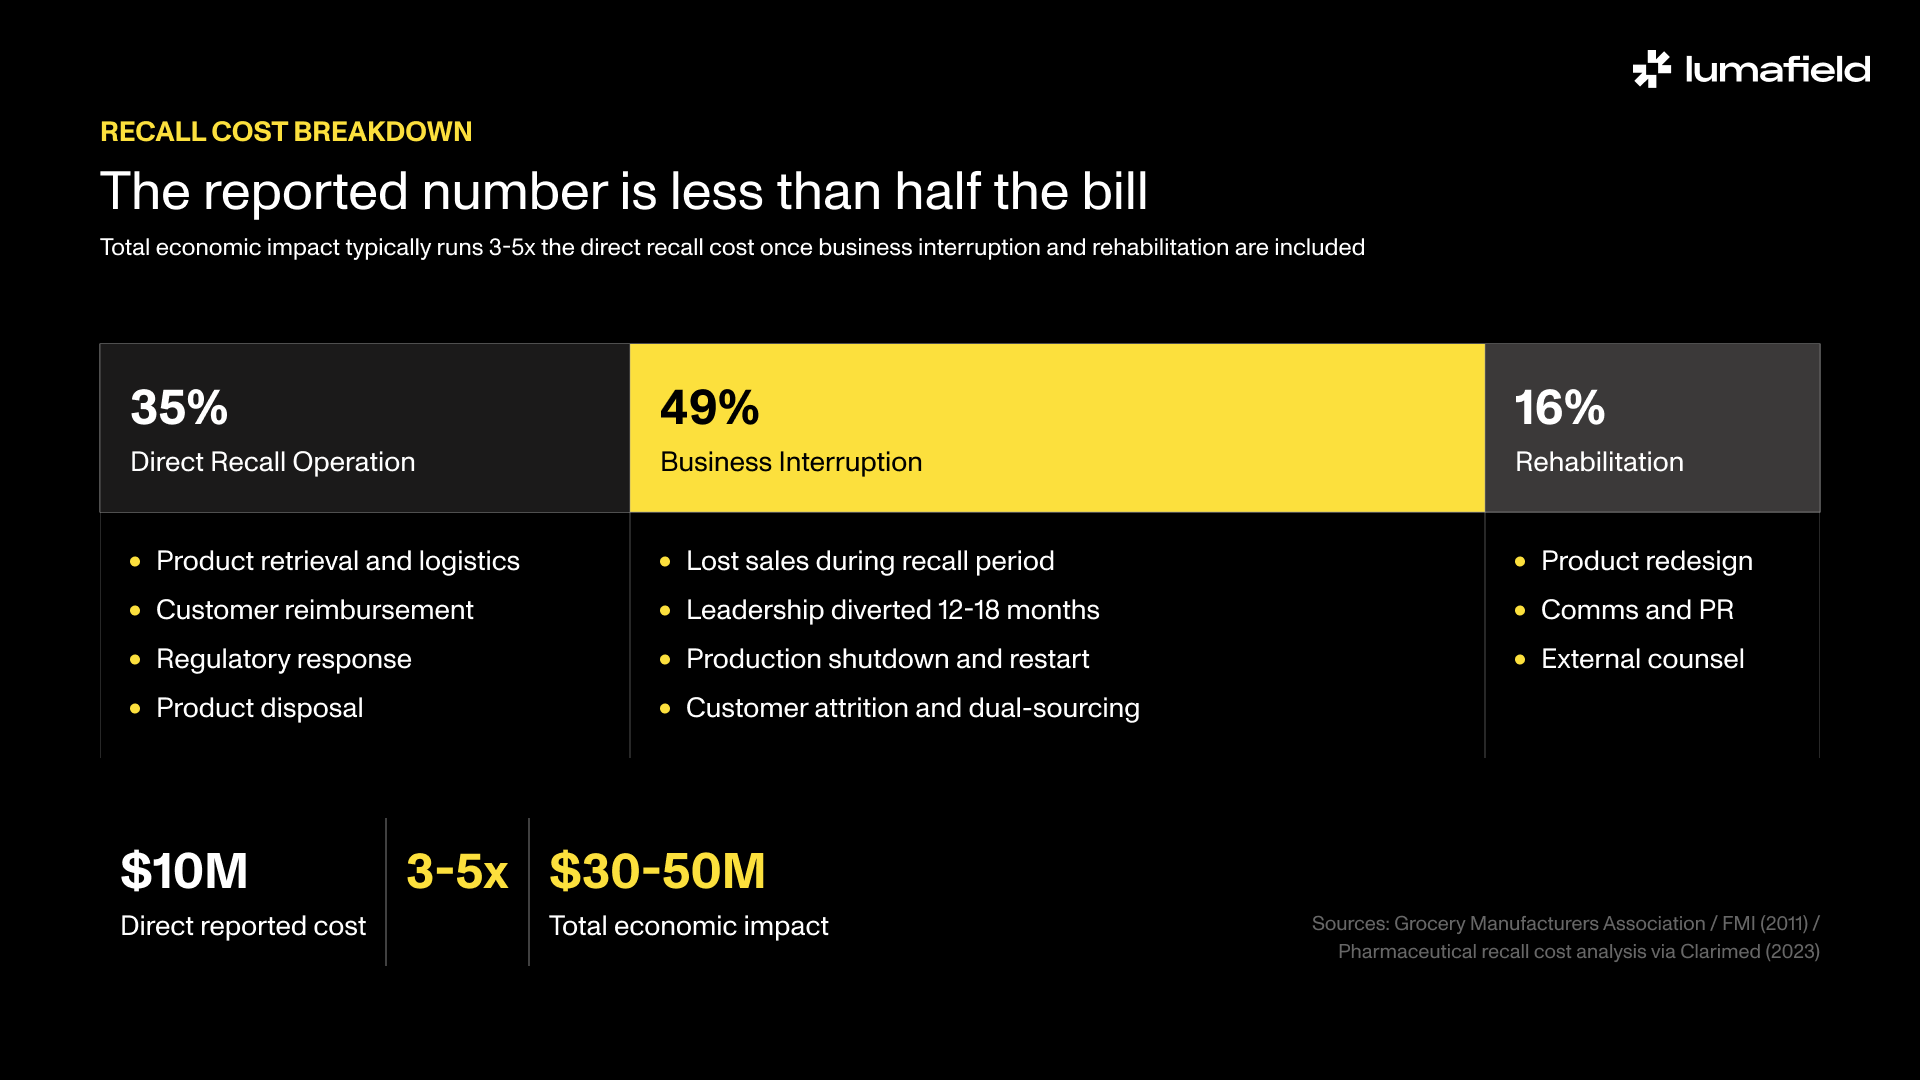
- Direct recall costs average $10 million per event for food manufacturers, but total economic impact typically runs three to five times higher once business interruption, litigation, and lost contracts are included.
- Business interruption accounts for roughly 49% of total recall cost, nearly twice the direct recall operation itself.
- The defect-escape interval, the time between when a defect enters the production system and when it is detected, is the most controllable variable in recall economics.
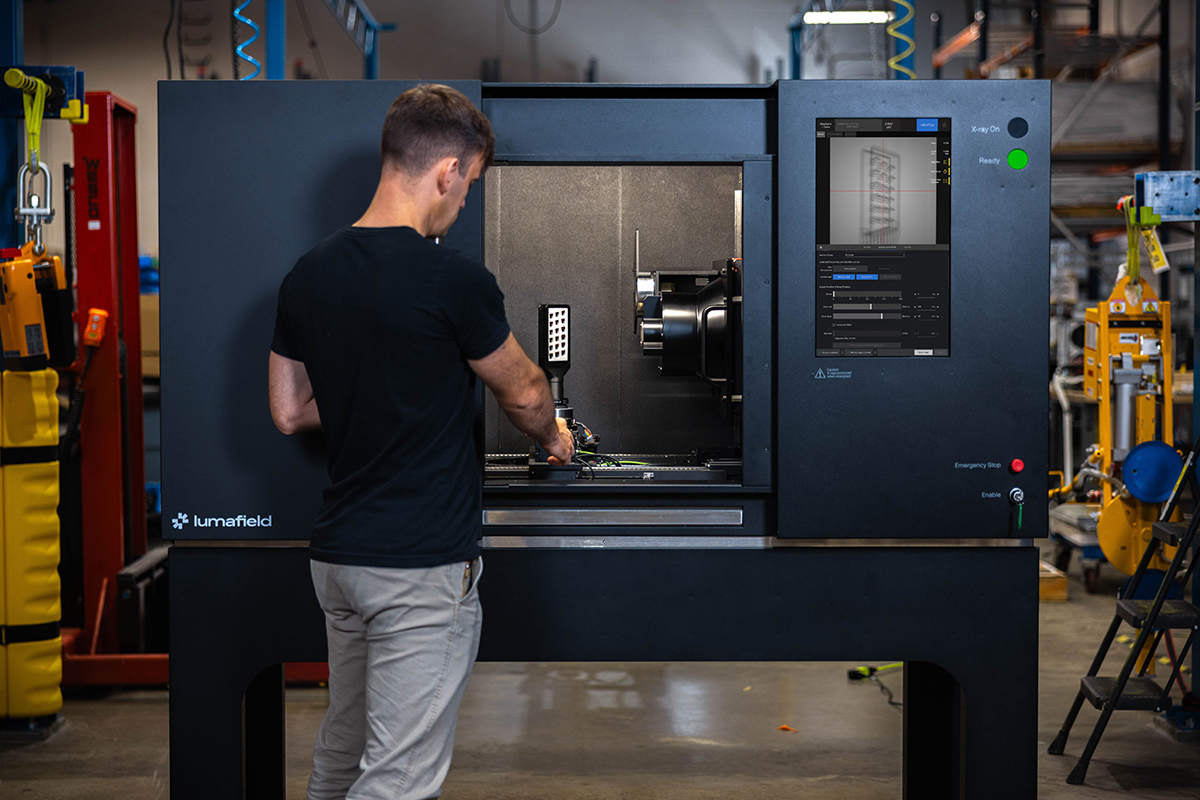
- Industrial CT scanning is the only non-destructive method that reveals internal defect classes before they escape to the field: voids, cracks, bond failures, and assembly errors invisible to conventional inspection.
- One supplier to a major prestige cosmetics brand used Lumafield CT to identify an internal packaging defect with no external signature, releasing $18 million in quarantined inventory and avoiding a potential recall of over one million units.
Every manufacturing organization has a number on its books for warranty claims. Very few have a number for the cost of the defects currently in the field that haven’t been found yet. That gap is where recalls originate.
A product recall is not a discrete event that arrives without warning. It’s the visible terminus of a long causal chain that began at a supplier, an assembly line, or an inspection station where a defect passed through undetected. By the time a recall is initiated, the organization has already been carrying the cost for months or years. It just didn’t know what to call it.
What a recall costs
The figure that circulates most widely comes from a 2011 Grocery Manufacturers Association study: the average food recall costs approximately $10 million in direct expenses. That number is real, but it’s the floor, not the ceiling, and it covers only one sector.
The GMA study itself found that 52% of companies that experienced a major recall reported total financial impact exceeding $10 million. For 1 in 20 companies, the impact exceeded $100 million. And that is for a sector with relatively short supply chains and established recall infrastructure. The figure also covers only direct costs: retrieval, disposal, customer reimbursement, regulatory response. It does not capture what typically runs 3-5x higher: business interruption, lost contract revenue, insurance premium increases, litigation exposure, and the organizational cost of pulling engineering and operations leadership off core work for 12-18 months.
A pharmaceutical recall cost analysis provides a more complete picture of that breakdown: roughly 35% of total recall cost is the direct recall operation, 49% is business interruption, and 16% is product rehabilitation, communications, and consulting. The headline number that gets cited in board presentations is less than half the actual bill.
For durable goods and industrial equipment, the economics are more punishing. AlixPartners reported that recall-related costs in North American automotive exceeded $20 billion in 2017 alone. Average recall cost per vehicle runs around $500, but that average obscures an extreme tail: GM's ignition switch recall cost more than $6.7 billion by the time settlements, vehicle repairs, and DOJ penalties were fully accounted for. Takata's worst-case internal estimate for replacing defective airbag inflators was approximately $24 billion. These aren’t outliers that prove the rule. Unfortunately, they’re the rule for organizations that allow latent defects to reach scale before catching it.
In the medical device sector, McKinsey estimated that significant quality events, including recalls, FDA enforcement actions, consent decrees, and litigation, cost the global industry $7 to $8.5 billion annually, or roughly 2% of sector sales. That’s not 2% of the budget of the organizations that had problems, that’s 2% of the entire sector's revenue, concentrated among the companies where the quality systems did not close the loop fast enough.
Where the cost originates
The direct costs of a recall are visible and therefore manageable. The real cost driver is time: specifically, how long a defect survived in the production system before it was caught.
FDA root-cause data for medical device recalls shows that materials and component failures from suppliers or sub-assemblies account for approximately 26% of recalls, with process control errors adding another 17%. Together, manufacturing and supplier-origin defects represent nearly half of all recall root causes in the most heavily audited manufacturing sector in the country.
The pattern holds in automotive. AlixPartners found that suppliers' share of total recall costs had risen to 15 to 20% by 2018, with the frequency of suppliers named in recall notices having doubled since 2013. The defect is increasingly starting upstream. The cost is still landing on the OEM.
The cost of a defect is anything but fixed. It multiplies with each stage it passes through undetected. A non-conforming component identified at incoming inspection costs a fraction of the same component identified at end-of-line testing, which costs a fraction of identifying it in an assembled product, which costs a fraction of identifying it in the field. The underlying principle (1:10:100), that a defect costs roughly one unit to resolve at the design stage, ten units at final assembly, and one hundred units after shipment, is a heuristic rather than a mathematical law, but the directional logic is supported by decades of manufacturing quality research and confirmed by organizations that have lived to tell the tale.
The defect-escape interval, the time between when a defect was introduced and when it was detected, is the single most controllable variable in recall economics. It’s almost always a detection method problem rather than a design problem.
Why defects escape
Conventional inspection methods share a structural limitation: they see surfaces. Visual inspection, coordinate measuring machines (CMMs), and standard 2D X-ray all capture what can be seen from the outside of a part or what’s visible from a particular angle. Internal geometry, subsurface voids, micro-cracks, bond failures between layers, and assembly errors concealed within a housing all fall outside what these methods can reliably detect.
A component can pass every quality gate in a conventional inspection program and still contain a defect that will cause a field failure under thermal cycling, mechanical stress, or years of normal use. This isn’t actually a failure of the inspection team. The truth is that it’s baked in. It’s a structural limitation of the inspection method.
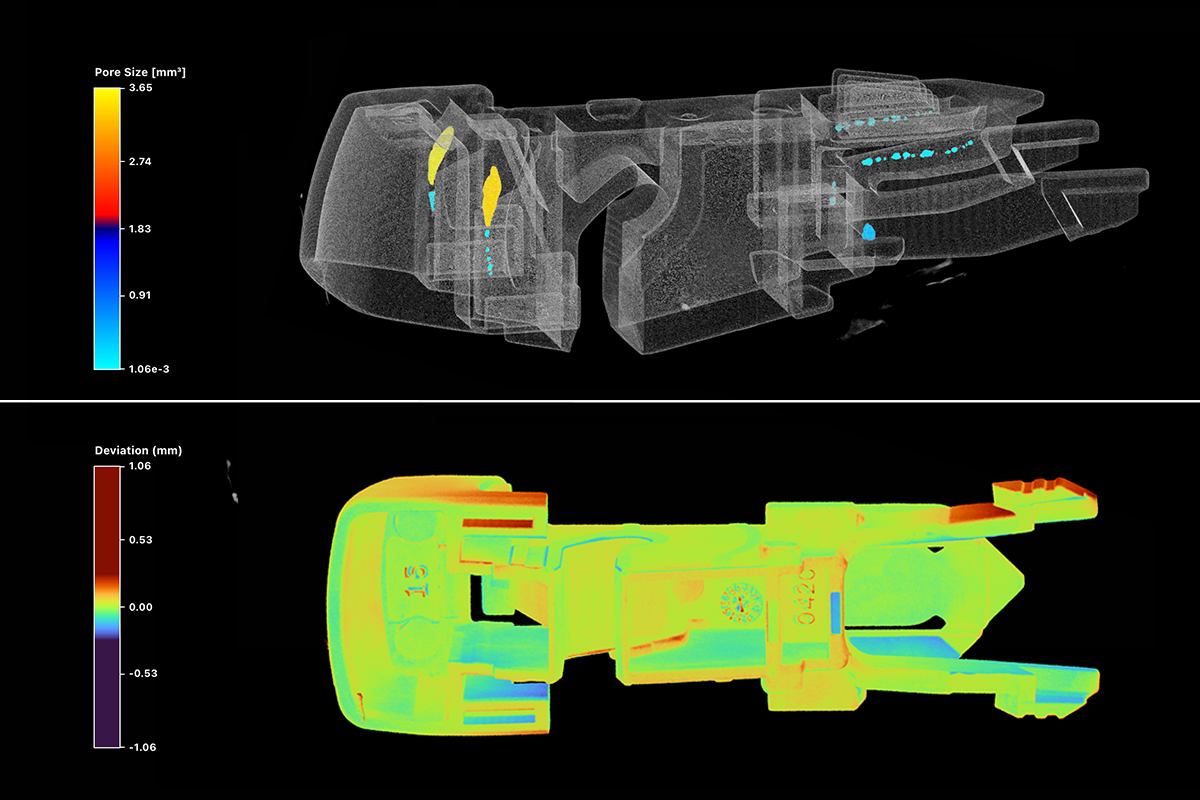
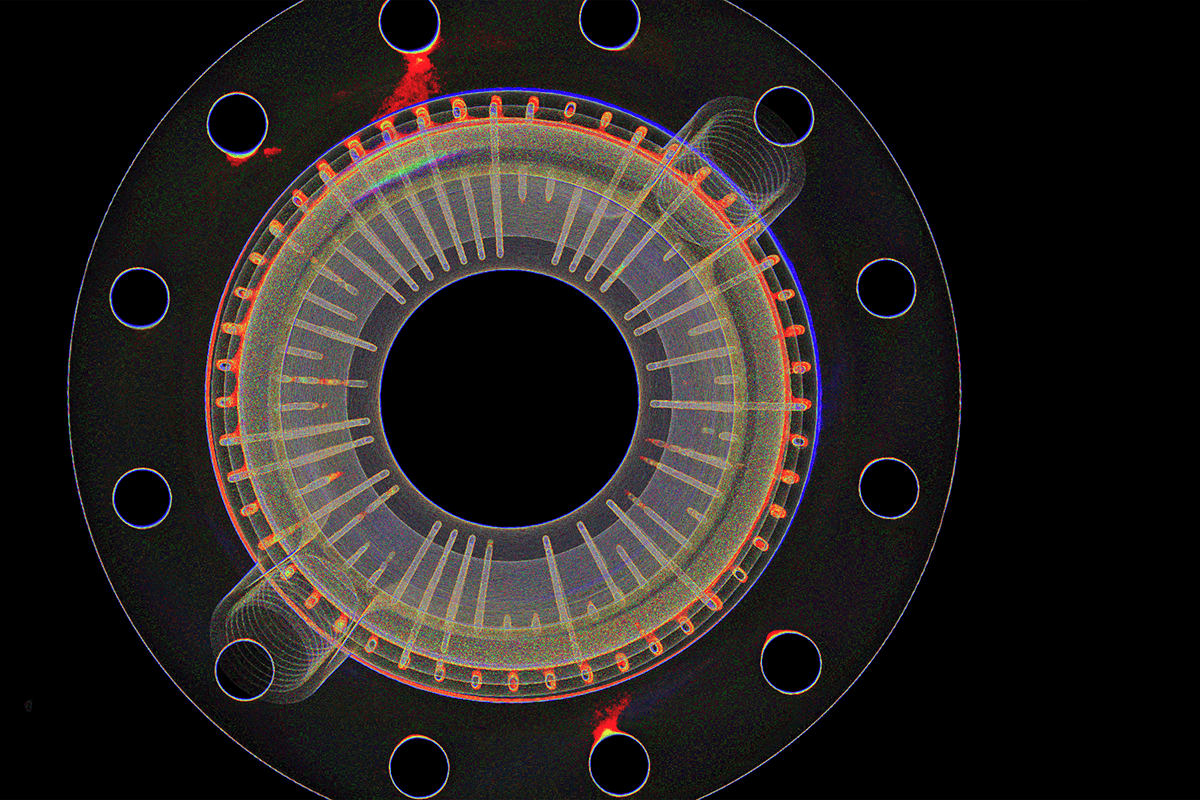
Bottom: The same clip overlaid against its CAD model. Red indicates excess material, blue indicates underfill. Every dimensional departure from design intent is visible in a single view.
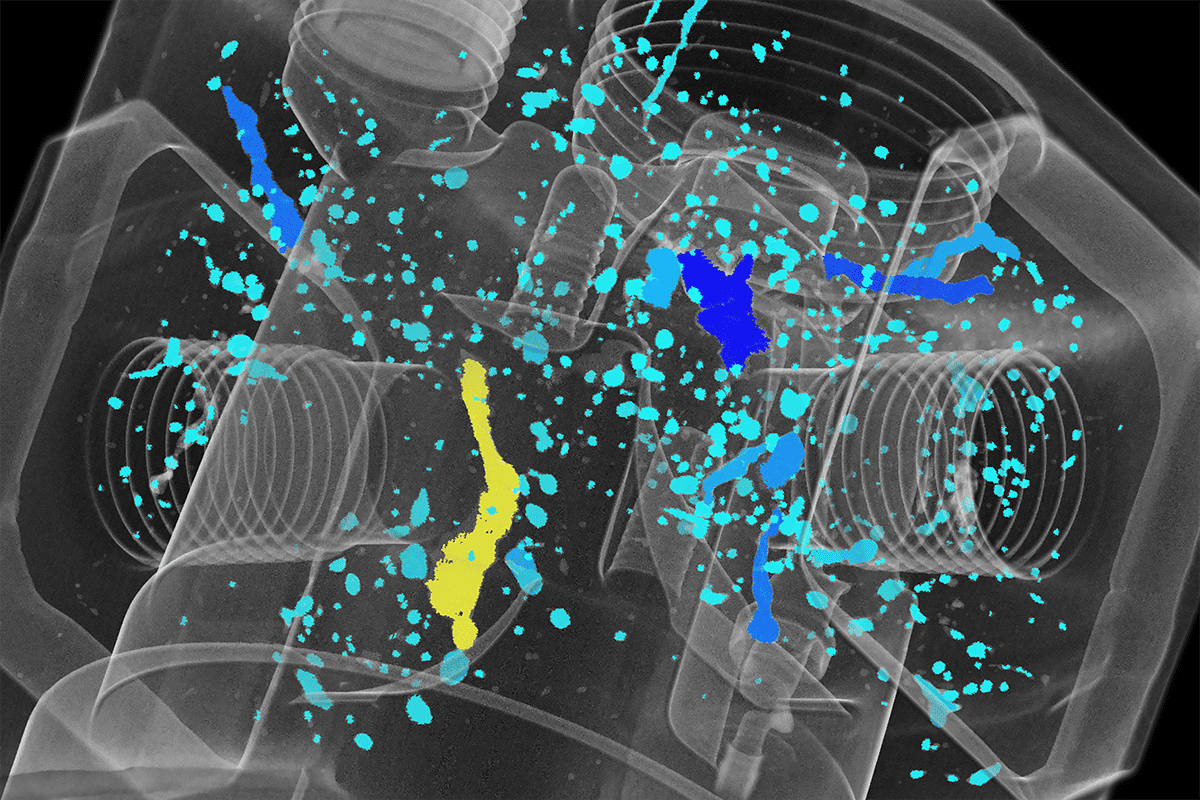
This is the specific gap that industrial CT scanning closes. By generating a volumetric, non-destructive image of the complete interior geometry of a part or assembly, CT inspection surfaces defect classes that conventional methods just can’t see: insufficient anode overhang inside a battery cell, cracks in a weld between two joined components, a delamination inside a composite structure, solder that appeared complete on a 2D X-ray but bridges two traces when viewed in three dimensions.
The manufacturers that have moved CT inspection upstream report catching defect classes that would have passed every prior inspection gate. The same capability also compresses resolution time when a quality event is already in progress. One supplier to a major prestige cosmetics brand recently used Lumafield's high-throughput CT system to identify the internal source of a packaging defect that had no visible external signature, releasing $18 million in quarantined inventory that would otherwise have required full destruction or manual disassembly to disposition. The affected batch totaled over 1 million units at roughly $15 MSRP. Had those units shipped and triggered a recall, the direct inventory cost would have been the tip of the iceberg. Retrieval logistics, FDA regulatory response for an OTC drug product, and retailer chargebacks would have compounded from there. Finding the defect source before that threshold is crossed is a quality win, but more importantly, it’s a major liability event avoided.
The question that matters
Most organizations know their warranty spend. Far fewer have visibility into whether that spend reflects a latent defect problem currently in their production system that has not yet reached the field.
The relevant question for a VP of Quality is not “What would a recall cost?” It’s “What’s in our production system right now that we can’t see?”
That question has an answer you can quantify. Getting to it requires inspection methods with the resolution to find what conventional quality programs miss. The organizations that have asked it earliest have paid the least to answer it.
Related Questions
What does the average product recall cost a manufacturer?
There is no single cross-industry average. The most credible primary data is sector-specific: the Grocery Manufacturers Association found direct food recall costs averaging around $10 million per event, with 52% of companies reporting total impact exceeding that figure. Total economic impact, including business interruption, litigation, and lost contracts, typically runs three to five times the direct cost.
What are the biggest hidden costs of a product recall?
Business interruption is the most consistently underestimated, accounting for approximately 49% of total recall cost in pharmaceutical case analysis, nearly twice the direct recall operation. The other two are organizational drag from pulling leadership off core work for twelve to eighteen months, and permanent revenue loss from customers who quietly exit rather than escalate.
How do manufacturers prevent product recalls?
Prevention requires shifting quality intervention upstream. Conventional inspection methods, including visual, CMM, and 2D X-ray, detect surface defects but miss internal voids, cracks, and bond failures. Industrial CT scanning generates a complete volumetric image of a part's interior without destroying it, catching defect classes that conventional methods pass. The manufacturers with the lowest escape rates inspect earlier and deeper.
At what stage do most defects that cause recalls originate?
At the supplier or sub-assembly stage, and most pass conventional inspection before reaching the OEM. FDA root-cause data shows supplier and component failures account for roughly 26% of medical device recalls. In automotive, AlixPartners found suppliers' share of recall costs reached 15 to 20% by 2018, with supplier-named recall notices doubling since 2013.
Why do defects pass inspection if the inspection program is working?
Because conventional methods inspect surfaces, not interiors. Voids, cracks, delaminations, and assembly errors inside a part are invisible to visual inspection, CMM, and 2D X-ray. A component can be dimensionally correct on every external surface and still contain a defect that causes field failure. This is a detection method boundary, not an inspector error.