Manufacturers Know Quality Costs Money. Most Don't Know How Much.
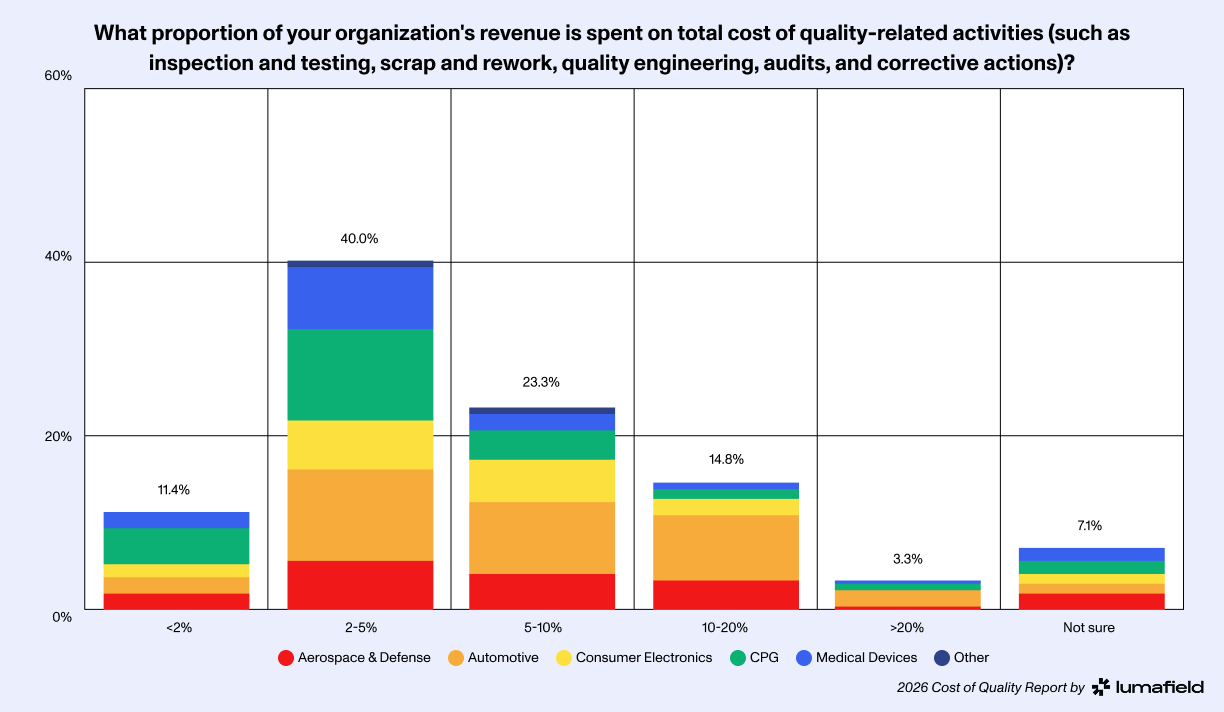
Quality costs every manufacturer money, and most believe they aren't capturing the full picture of exactly how much. 40% of the decision-makers we surveyed estimate that quality-related costs consume 2-5% of their revenue, while 42% place that figure at over 5%. Those figures are already sizable, but the majority think even those numbers understate the truth. The hidden costs, from lost sales and reputational damage to engineering hours consumed by firefighting, rarely make it into formal tracking.
Lumafield is a manufacturing intelligence platform that works with quality teams across industries to help them see inside their products, trace root causes, and build operational visibility that turns quality from a cost center into a competitive advantage. That work puts us in close contact with the measurement gaps, technology decisions, and organizational pressures that define quality management today, and we wanted to benchmark these challenges across and within industries.
To do that, we commissioned an independent survey of 210 quality decision-makers across aerospace and defense, automotive, consumer electronics, consumer packaged goods, and medical devices in the US and Canada with NewtonX. The resulting dataset is a novel, cross-industry benchmark of how North American manufacturers measure, spend on, and prioritize quality today, along with detailed findings for each of the five industries we surveyed.
The results are striking. Only 35% of respondents use a comprehensive COQ model, despite the framework having existed since the 1950s, and 58% believe at least a quarter of their true quality costs go unaccounted for. Supplier-related quality issues ranked as the top concern across every industry we surveyed, with 41% identifying it as the single category where a 25% reduction would have the greatest operational impact.

The report also captures a manufacturing environment under significant external pressures. 62% of respondents say tariffs and trade barriers have made it harder to ensure quality, driven largely by component shortages. Additionally, 54% of respondents say their suppliers have downgraded quality to offset tariff costs, and 27% report suppliers misrepresenting country of origin. Sentiment is cautiously positive overall, but the data makes clear that most organizations are managing quality with an incomplete picture of what it actually costs them.
The Lumafield Cost of Quality Report is available now. Take a short quiz to see how your organization compares to our full benchmark sample.