Design to Reality
Evolution of the Plastic Bottle
In the dark nights of my soul, I fret about how inconsistently engineered my life is. The coffee table I made a year or two ago was intended to look like the dining room table I built a few years earlier, but in reality the two bear only a vague resemblance to each other. Open a drawer of my tool chest at random, and perhaps you’ll find a thematically-aligned collection of well-loved hand tools, meticulously cut into a nest of Kaizen foam, or maybe you’ll find a random assortment of half-forgotten specialty wrenches. My bookshelf is nicely sorted and stacked, but my magazines are dumped into a basket this way and that.
We manage to invest embarrassing amounts of engineering and infrastructure into physical objects that are barely worth mentioning.
So when I look out at the world outside of my own home, I am reassured to find that even our most disposable objects are the result of staggering quantities of serious and earnest engineering work. You’ve got to give it to humanity: We don’t just put all of our design cycles on the big, impressive projects—pyramids, bridges, and semiconductor fabs. No: We manage to invest embarrassing amounts of engineering and infrastructure into physical objects that are barely worth mentioning. Stuffed animals, given away as carnival prizes, are the beneficiaries of untold logistical and supply-chain management efforts. A pair of pantyhose might contain materials that required eight or nine figures’ worth of R&D work to develop. A plastic water bottle, whose entire usable lifespan is measured in seconds, is the result of decades upon decades of engineering across a range of functions.
From glass to plastic
I stand up, put on my shoes, and walk over to the grocery store. The walk to the grocery store takes maybe 120 seconds, and I walk it about once a day. I recognize that this is absurdly frequent and revel in treating the grocery store as an extension of my pantry. Today, I get ketchup and crackers then scoot around to the dairy aisle for unsalted butter. Walking past the bottled water I pause—the selection there is honestly incredible, a little Darwinian competition playing out on the shelves. I stand there, registering the different phenotypes and thinking about how each species and sub-species of water bottle evolved. A guy in his thirties reaches in front of me to grab a gallon-sized jug of Poland Spring from the shelf. I make room for him, consider my options, and for some reason end up with a liter each of Pellegrino, Evian, and Smartwater.
As weird as it sounds, water from the Evian source was bottled in earthenware jugs from 1826 all the way until 1908. Glass and glassblowing were not all that reliable in the belly of the nineteenth century, but around the turn of the twentieth, glass technology had trickled down from lenses and lightbulbs to proliferate within beverage packaging. If you were starting a bottling company in 1900, you probably started in glass. Coca-Cola was first bottled (in glass) in 1899, the same year that Pellegrino, with their distinctive green glass bottle, was founded. Evian switched to glass in 1908.
Coke’s acrylonitrile misadventure
While synthetic plastics were first developed in the 1880s, and Dustin Hoffman was getting lectured about the material’s business potential in 1967, it wasn’t until the mid-‘70s that food-safe (or at least vaguely food-compatible) formulations began to roll out. One of the most notable of these was acrylonitrile copolymer, which was brought to market in the form of Coca-Cola’s “Easy-Goer” bottle in 1975. Coke’s acrylonitrile bottles lasted less than two years on the market.
From an engineering perspective, acrylonitrile copolymer was a great fit for soda bottles. It was transparent, tough, and impervious to gas. Coca-Cola executives touted its “environmental advantages” (namely its lower shipped weight) and its resistance to biodegradation, claiming that the bottles, which were manufactured by Monsanto, would cost “essentially the same as glass.” Pepsi, who had also been working on plastic bottles, fumed on the sidelines. While Coke was camped out at a hotel launching the Easy-Goer, Pepsi held a competing PR event, down the hall at the same hotel, to unveil “a champagne from the Soviet Union.” The short career (1975-1977) of Coke’s Monsanto-designed Easy-Goer acrylonitrile bottle. This author was unable to definitively identify imagery of Pepsi’s Soviet champagne, but this state-owned Russian site seems to indicate it was Nazdorovya.
The Easy-Goer bottles were, to my taste, a bit on the chunky side. Coke’s acrylonitrile bottles lasted less than two years on the market. It turns out acrylonitrile bottles will leach acrylonitrile into whatever liquids they contain; furthermore, test animals who were fed “large amounts of acrylonitrile in their drinking water” developed “significantly lower body weight and other adverse effects, including lesions in the central nervous system and growths in the ear ducts.” The FDA banned acrylonitrile beverage containers in March of 1977; Monsanto sued and lost; Coke looked to other materials.
Injection Stretch Blow Molding (ISBM)
Here’s how most plastic beverage bottles are made today: A bottle preform, also known as a parison, is typically injection-molded out of PET. The preform looks kind of like a test tube, with threads at its mouth and a disc-like collar just below. Its walls are thick. Maybe it’s stored for a while, still devoid of cap, but eventually it’s installed onto a stretch blow molding machine where it’s heated, stretched lengthwise internally with a metal rod, and injected with compressed air, blowing up rapidly like a balloon before being cooled and spat out. The same preform might be blown into a variety of different bottle designs, each with different volumes and wall thicknesses and design details, but their thread profiles and necks will remain identical to the preform from which they were made.
Coke’s Easy-Goers had metal caps, but today virtually all plastic bottles are also capped in plastic. Plastic caps are injection or compression molded, with their tamper-evident rings attached. The injection molds are honestly beautiful—polished, multi-part assemblies, with twelve or twenty-four or forty-eight caps all being molded at the same time. Watching caps being compression molded, meanwhile, is mesmerizing: semi-soft blobs of plastic goop being extruded, cut, and squished into a rotating tool that then dumps a finished cap assembly off of its backside. Either way, when caps meet their bottles the bottles will have been filled with some fluid, and in some cases pressurized with carbon dioxide gas (for that bubbly sizzle) or liquid nitrogen (for structural and preservative reasons). This all happens at staggeringly high speed, dozens of bottles per second, tens of thousands of bottles per hour, frankly unfathomable numbers of bottles per day. Injection stretch blow molding forms bottles in two stages: a heated PET preform is stretched and blown inside a mold, aligning the polymer chains to create a lightweight container with high strength and clarity.
The rise of PET
Again, I’m struck by the stupidly obvious fact that human beings invented all of this stuff. Real people, with dreams and fears and families to support, spent big chunks of their lives inventing not only the beverage packaging itself but the machinery required to make, fill, cap, and package these unfathomable numbers of bottles. Disposable water bottle engineering is a career path that you could choose, and if you did choose it then you would not be alone in having done so.
While Monsanto had been toiling away on their yet-unproven acrylonitrile copolymer bottles, there was an entirely different group, at DuPont, working on polyethylene terephthalate.
Even more incredible is the fact that some of Dustin Hoffman’s contemporaries—indeed lots of them—chose careers in plastic bottle engineering, even before plastic bottles had been proven viable. While Monsanto had been toiling away on their yet-unproven acrylonitrile copolymer bottles, there was an entirely different group, at DuPont, working on polyethylene terephthalate. Polyethylene Terephthalate, “PET.” So many ethylenes! Take a bunch of gaseous ethylene molecules, and catalyze them with metal salts such that they form long, caterpillar-like solid molecules, with each segment containing one carbon atom and two hydrogen atoms. In this form, bulk polyethylene can be incredibly strong and durable, especially when the caterpillar-like molecules get really long. (Ultra-high-molecular-weight polyethylene, whose chained-together ethylenes can be hundreds of thousands of units long, has yield strengths comparable to steel—at dramatically lower densities. Lots of high-end sailing rigging is made from this stuff, and also ultralight camping gear.) Polyethylene is also environmentally stable, optically clear, and doesn’t, like acrylonitrile, leach into food or beverages that it’s put into contact with. People have been catalyzing polyethylene this way for about 75 years now, and because of its remarkable physical properties, we now make more of the stuff than any other polymer; today, global annual polyethylene production is something on the order of a hundred million metric tons—equivalent in mass to almost eight years’ worth of New York City’s solid trash production.
Within two years of the Easy-Goer’s downfall, DuPont was in full production, making two-liter PET bottles for the Coca-Cola company’s caramel-colored sugar water.
I can just imagine the excitement at DuPont’s polyethylene team when the FDA put an end to Coke’s acrylonitrile adventures. DuPont had been working on soda bottles since at least 1967, when Nathaniel Wyeth (a DuPont “engineering fellow” who was also the other brother of painter Andrew Wyeth) began tinkering with polypropylene. By this time the younger Wyeth had a painting in the permanent collection at MoMA; I imagine Nathaniel, the less famous Wyeth, crawling around in the chemical weeds, grasping for some way to make his own name. Finally he found his path through the undergrowth: A “hollow thermoplastic article,” which he patented in 1973. Within two years of the Easy-Goer’s downfall, DuPont was in full production, making two-liter PET bottles for the Coca-Cola company’s caramel-colored sugar water. Wyeth’s 1990 obituary showcases his invention of the now-ubiquitous PET plastic soda bottle. Source: New York Times.
I actually remember these bottles from the birthday parties of my youth. Produced from the late ‘70s until the early ‘90s, the first generation of enormous PET beverage containers, with their opaque, glued-on bases, arose in tandem with the soda industry’s shift to high fructose corn syrup. Both “New” Coke and “Crystal” Pepsi were packaged in these thick-walled, two-liter bottles, our parents using two hands to pour them into our trembling plastic cups. These bottles were totems to American excess, their contents slowly going flat in the fridge if they weren’t spilled all over the dining room table first.
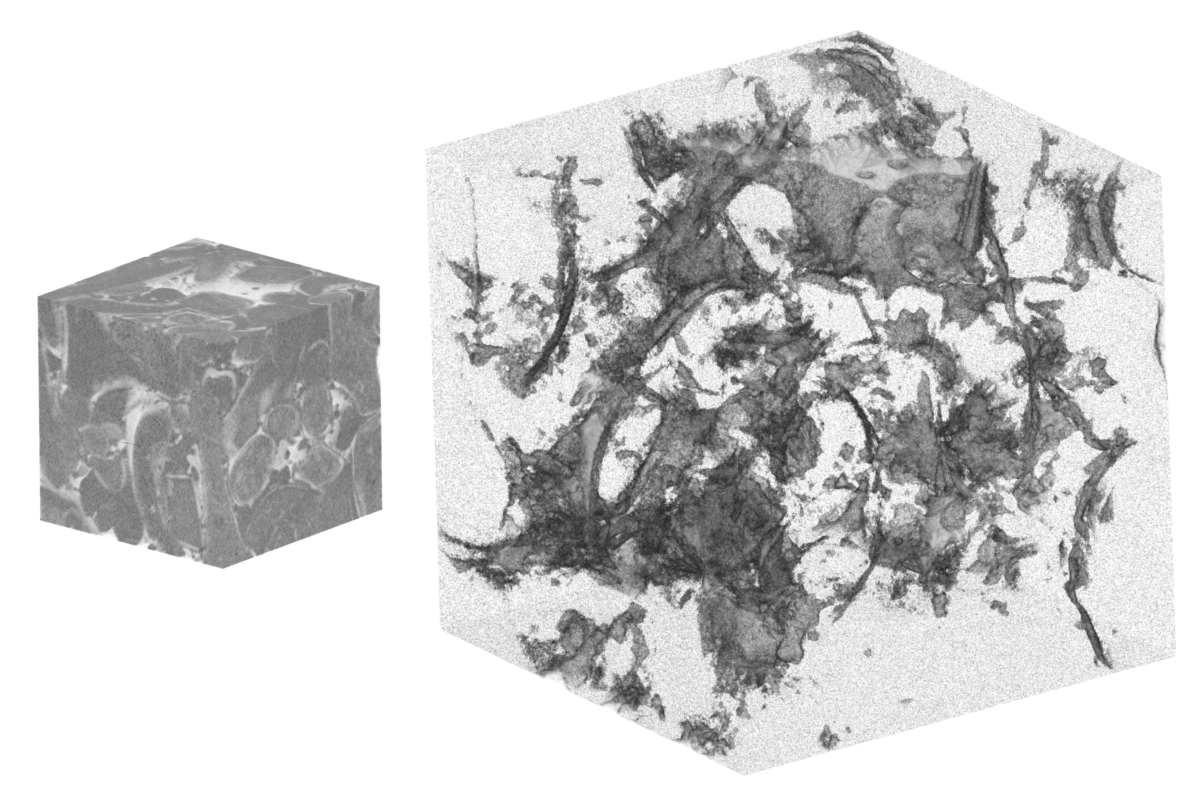
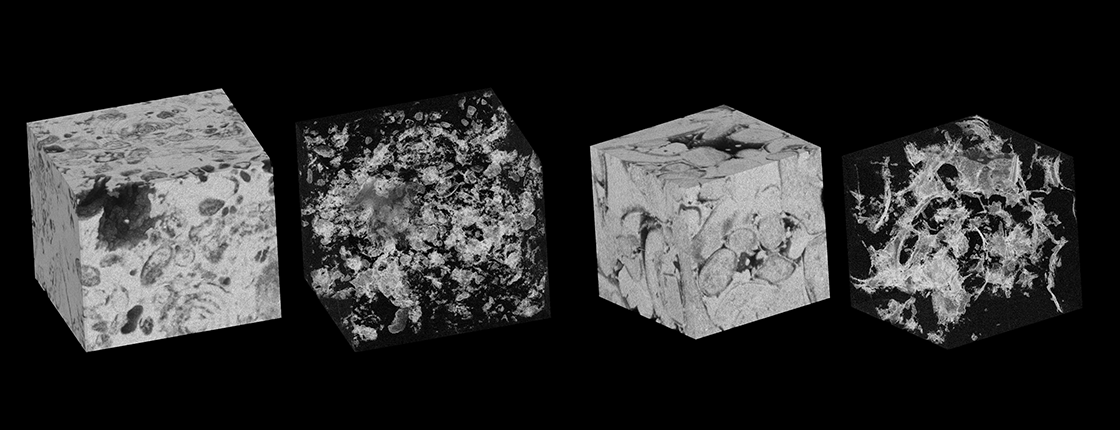
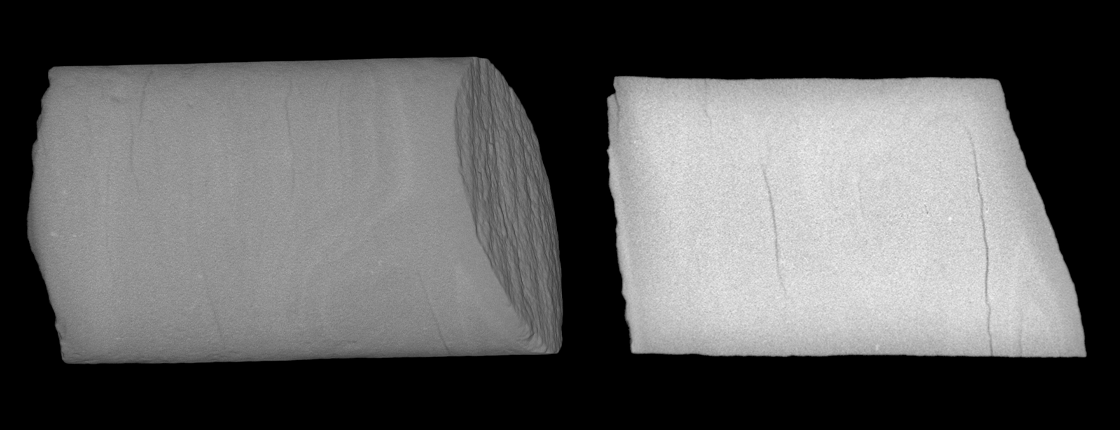
Looking back at these beefy containers, one can’t help but feel that it’s all too much. Too much sugar, too much plastic, too much overt product placement in our holiday movies. The walls on Coke’s early two-liter bottles were around 0.3 to 0.4 mm thick, and their glued-on bases (which were necessary because the bottles themselves had round bottoms—good for resisting internal pressure, but terrible at standing upright) measured up to 0.6 mm. As a result, the total mass of an empty two-liter bottle was up to 96 grams—exactly double that of modern two-liter bottles. This was, from today’s standpoint, a low-volume product, not really optimized for cost or transportation. The beverage industry had figured out how to get the public to buy their drinks in disposable plastic bottles, but they hadn’t figured out how to efficiently produce and sell billions of them every year. Industrial CT scans show a reduction in wall thickness that allowed packaging engineers to cut the total mass of the 2L bottle in half since the introduction of PET beverage bottles. For more on the original vs. present day Coke bottle, check out Scan of the Month.
But you can be sure that corporate chemical engineers (and marketers) were working hard on just that problem. By the early 1990s, both Coke and Pepsi figured out just what beverage they could sell us billions of disposable plastic bottles of. The solution didn’t come from a mountain spring, or a Soviet vineyard, or the concentrated carbohydrates extracted from industrially-farmed corn. No, the killer application for the disposable plastic bottle industry was a municipal water tap in Wichita, Kansas.
Bottled water boom
Looking back on it now, the bottled water boom feels like a ridiculous—yet understandable—evolution of our early ‘90s milk-cartons-and-two-liter-soda-bottles culture. The signs were there in 1992, when after a bidding war, Nestlé acquired Perrier, gaining not only the distinctively bubbly French brand but also Poland Spring, Arrowhead, and Great Bear in the same transaction. Then in 1994, Pepsi introduced Aquafina, with its clear half-liter bottles and unremarkable branding sketching out the decidedly middlebrow aesthetic that would define the emerging mass-market bottled water industry. Not to be left behind, Coke launched Dasani (a direct competitor to Aquafina, albeit with slightly more distinctive branding) in 1999.
These brands’ yuppie appeal never really spoke to me personally; they felt gauche, corporate, superfluous. But I do recall buying bottles of Vitaminwater (the Glacéau-owned sister-brand to Smartwater) and thinking of myself (then a teenager) as sophisticated, and vaguely “alternative.” This feeling lasted roughly until the precise moment when Glacéau was acquired by Coca-Cola, in May of 2007. In the years that followed I purchased their products only in times of distress. Today’s lightweight half-liter water bottles use 75% less plastic than those on the market in the mid-2000s.
Regardless of my own feelings, I must admit that brands like Aquafina, Dasani, and Smartwater did good work in helping Pepsi and Coke replace their declining soda sales in the late ‘90s and the early ‘00s. They also gave the soda giants an opportunity to really cost-engineer their bottling operations, tweaking their bottle and cap designs to reduce mass and shorten manufacturing cycle times. “Petaloid” bottle bases, which came to prominence in the ‘90s, eliminated the need for glued-on bases—reducing material usage while distributing stress more evenly across the bottle’s walls. Thinner bottle walls (Aquafina’s were around .2 mm) and shorter caps meant faster bottle production; spiral ribbing on the bottles’ walls meant that they could be stacked higher and would resist damage during shipping. Dasani- and Aquafina-branded vending machines, stocked by existing soft drink distributors, kept products moving through supply chains efficiently. Eventually, many water bottlers—Coke, Pepsi, Evian, Nestlé—switched portions of their production to 100% recycled polyethylene, which has proven to be durable, commercially desirable, and food-safe.
Lightweighting and efficiency
Once bottled water proved itself as a high-volume consumer product, its variations proliferated. Look in almost any beverage section, in any store in the US, and you’ll find water packaged not only in PET bottles but also in glass, aluminum cans, and multi-layered paperboard boxes. My tiny urban grocery store allocates about as much shelf space to bottled water as they do to bread. Even tiny, outer-borough NYC bodegas usually carry broad arrays of bottled water brands, many of which are shipped in from halfway around the world.
Niagara (a privately-held company with around 7,500 employees working in more than a dozen bottling facilities) claims to have reduced the amount of plastic in their half-liter bottle by 60% since 1998, with similarly impressive reductions in their carbon footprint.
As the market evolved, a staggering amount of work was done to reduce the mass of commodity-grade disposable water bottles. Today, even white-labeled water bottles—bland, bottom-of-the-barrel brands, mostly devoid of character and sold only in racks of twenty-four or greater—benefit from decades upon decades of optimization. An excellent example of this is the Niagara “Eco-Air” half-liter bottle, variations of which are sold under house-label brands like Walgreens’ Nice!, Costco’s Kirkland, and Albertson’s Signature Select. Niagara (a privately-held company with around 7,500 employees working in more than a dozen bottling facilities) claims to have reduced the amount of plastic in their half-liter bottle by 60% since 1998, with similarly impressive reductions in their carbon footprint. Flimsy in the hand even when full of water, their bottles have wall thicknesses of less than 0.17 mm. PET bottles offer one of the most efficient packaging-to-product ratios, combining minimal material use with strong protection and product safety. Both the bottles and caps are fully recyclable and contain no added BPA. Source: Niagara Bottling.
Even so, these flyweight bottles are surprisingly strong, their physical properties tuned to the needs of modern logistical and commercial infrastructure. Bottles like Niagara’s Eco-Air (which is similar to Poland Spring’s half-liter bottle) are typically shrink-wrapped into 32-bottle packs, which are then shipped hundreds or thousands of miles before they’re dumped on our grocery stores’ loading areas. These brick-like bundles of plasticized water are not handled with a ton of care en route, and in the case of my grocery store they’re piled in chest-high stacks near the check-out aisles. This is what manufacturers like Niagara cares about: Their bottles need to be just strong enough to survive the trip to my grocery store, and then the subsequent jaunt to whatever block party or school potluck they might be ripped open at. Because once their caps are unscrewed, these bottles’ half-lives are measured in seconds.
Recycling and reuse
Half-liter bottles like the Eco-Air are ubiquitous in my neighborhood. There are hundreds of them at each of the corner stores within crawling distance of my stoop, and additional dozens of them (emptied of their original contents, and then sometimes filled with something less refreshing) on the sidewalks and curbs nearby. We are lucky if these bottles end up in landfills; they certainly end up in worse places much of the time.
After I had drunk my liter of San Pellegrino straight from its green glass bottle, I tossed the bottle into the recycling bin with a confusing mixture of pride and shame. A few days later, the city’s Sanitation Department picked it up; I know from experience that it was bound to be broken up into little green glass chips at a transfer facility on the shore of the New York Harbor. But my crushed Pellegrino bottle isn’t sorted into a big pile of pure green glass; it’s mixed with other colored glass, which is difficult to sort into its constituent parts and can’t easily be re-melted into new containers. More or less useless at that point, this multicolored melange is likely to be sold as fill material for an infrastructure project—if it’s not landfilled directly.
What’s next for packaging?
It’s harder to say where the plastic bottles I purchased will end up. After drinking the Evian and the Smartwater, I found myself refilling both of their PET bottles with NYC tap water, and over the following weeks I proudly—and repeatedly—lugged one or the other of them with me as I biked to the climbing gym, hoping secretly that someone there would recognize them as some of the most popular water containers among the ultralight hiking community But at some point even the luckiest and most long-lived polyethylene bottles will be trashed. But, who knows. If you wait around long enough, someone’s bound to start working on solving that problem too.